.swiper-chart-examples {
width: 100%;
height: 100%;
padding: 0;
overflow: visible;
cursor: grab;
}
.swiper-slide {
display: -webkit-box;
display: -ms-flexbox;
display: -webkit-flex;
display: flex;
padding: 45px;
color: #4a5456;
font-size: 16px;
line-height: 1.5;
border-radius: 25px;
box-shadow: 0px 20px 30px rgba(46, 178, 237, 0.2);;
}
@media screen and (min-width: 992px) {
.swiper-wrapper, .swiper-slide {
max-height: 455px;
}
}
.swiper-slide:nth-child(odd) {
background: linear-gradient(36.88deg, #F1FCFF 40.57%, #FFF6F3 87.91%);
}
.swiper-slide:nth-child(even) {
background: linear-gradient(337.34deg, #F1FCFF 12.87%, #FFF6F3 96.51%);
}
.swiper-col.col-left {
width: 49%;
}
img.examples-img {
width: 100%;
border: solid 1px #e1e4eb;
border-radius: 20px;
transform: translateY(0);
-webkit-transition: all 0.2s ease-in-out;
-moz-transition: all 0.2s ease-in-out;
transition: all 0.2s ease-in-out;
}
@media screen and (min-width: 800px) {
img.examples-img:hover {
border: solid 1px #1655b2;
transform: scale(1.025);
box-shadow: 0 15px 22px rgba(46, 178, 237, 0.2);
}
}
.swiper-col.col-right {
position: relative;
width: 51%;
padding: 0 0 0 30px;
}
h4.examples-title {
margin: 0 0 10px 0;
font-weight: 700 !important;
}
p.examples-copy {
margin-bottom: 85px;
}
p.examples-slide-label {
position: absolute;
bottom: 0;
right: 0;
margin: 0;
color: #191f21;
background-repeat: no-repeat;
background-position: center;
font-size: 40px;
font-weight: 700;
line-height: 1.5;
}
.swiper-slide:nth-child(3n + 1) > .col-right > p.examples-slide-label {
background-image: url("data:image/svg+xml,%3C%3Fxml version='1.0' encoding='utf-8'%3F%3E%3C!-- Generator: Adobe Illustrator 26.4.1 SVG Export Plug-In . SVG Version: 6.00 Build 0) --%3E%3Csvg version='1.1' xmlns='http://www.w3.org/2000/svg' xmlns:xlink='http://www.w3.org/1999/xlink' x='0px' y='0px' viewBox='0 0 170 150' style='enable-background:new 0 0 170 150%3B' xml:space='preserve'%3E%3Cstyle type='text/css'%3E.icon-triangle-fill-red-0%7Bopacity:0.12%3B%7D.icon-triangle-fill-red-1%7Bfill:%23E95842%3B%7D%3C/style%3E%3Cg class='icon-triangle-fill-red-0'%3E%3Cpath class='icon-triangle-fill-red-1' d='M167.8 131.8L95.3 6.1c-4.7-8.1-16.4-8.1-21 0L1.6 131.8C-3 139.9 2.8 150 12.2 150h145.1C166.6 150 172.5 139.9 167.8 131.8z'/%3E%3C/g%3E%3C/svg%3E");
}
.swiper-slide:nth-child(3n + 2) > .col-right > p.examples-slide-label {
background-image: url("data:image/svg+xml,%3C%3Fxml version='1.0' encoding='utf-8'%3F%3E%3C!-- Generator: Adobe Illustrator 26.4.1 SVG Export Plug-In . SVG Version: 6.00 Build 0) --%3E%3Csvg version='1.1' xmlns='http://www.w3.org/2000/svg' xmlns:xlink='http://www.w3.org/1999/xlink' x='0px' y='0px' viewBox='0 0 150 150' style='enable-background:new 0 0 150 150%3B' xml:space='preserve'%3E%3Cstyle type='text/css'%3E.icon-square-fill-blue-0%7Bfill:%232EB2ED%3Bfill-opacity:0.16%3B%7D%3C/style%3E%3Cpath class='icon-square-fill-blue-0' d='M130 0H20C8.9 0 0 8.9 0 20v110c0 11 8.9 20 20 20h110c11 0 20-8.9 20-20V20C150 8.9 141.1 0 130 0z'/%3E%3C/svg%3E");
}
.swiper-slide:nth-child(3n + 3) > .col-right > p.examples-slide-label {
background-image: url("data:image/svg+xml,%3C%3Fxml version='1.0' encoding='utf-8'%3F%3E%3C!-- Generator: Adobe Illustrator 26.4.1 SVG Export Plug-In . SVG Version: 6.00 Build 0) --%3E%3Csvg version='1.1' xmlns='http://www.w3.org/2000/svg' xmlns:xlink='http://www.w3.org/1999/xlink' x='0px' y='0px' viewBox='0 0 150 150' style='enable-background:new 0 0 150 150%3B' xml:space='preserve'%3E%3Cstyle type='text/css'%3E.icon-circle-fill-0%7Bopacity:0.22%3B%7D.icon-circle-fill-1%7Bfill:%23B7B7B7%3B%7D%3C/style%3E%3Cg class='icon-circle-fill-0'%3E%3Cpath class='icon-circle-fill-1' d='M75 149.9c41.4 0 75-33.6 75-75c0-41.4-33.6-75-75-75C33.6 0 0 33.6 0 75C0 116.4 33.6 149.9 75 149.9z'/%3E%3C/g%3E%3C/svg%3E");
}
@media screen and (max-width: 991px) {
.swiper-slide {
display: block;
padding: 25px;
}
.swiper-col.col-left, .swiper-col.col-right {
width: 100%;
}
img.examples-img {
border-radius: 15px;
}
.swiper-col.col-right {
padding: 20px 0 0 0;
}
p.examples-copy {
margin-bottom: 0;
padding-bottom: 85px;
}
p.examples-slide-label {
font-size: 24px !important;
}
}

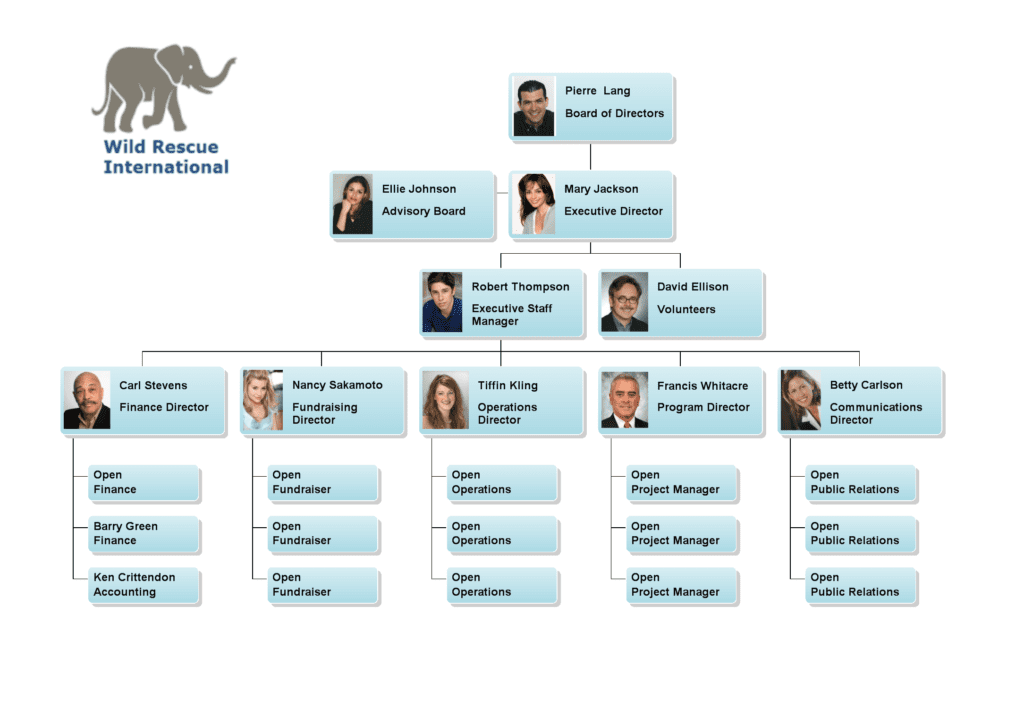
Charting a Non‑Profit Organisation
Relying heavily volunteers, Non-Profits face unique challenges managing their workforce. OrgChart features the tools Non-Profit organisations need to quickly generate and maintain a chart of their organisation identifying the both paid Staff and the Volunteers positions within the organisation.
1/12
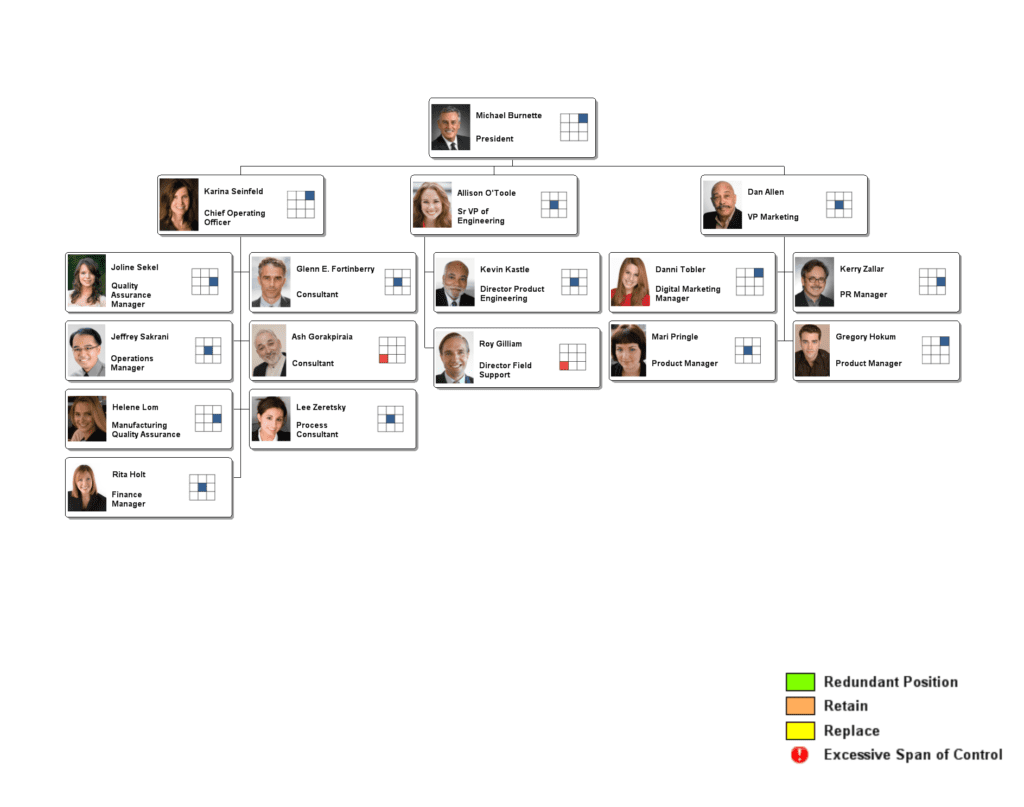
Charting Employee Performance
A 9-box is a common way to display employee performance and span of control. OrgChart offers built-in 9-box support, allowing you import your all your employee data then superimpose nine-charts on your org chart to provide a snapshot of performance across your organisation.
2/12
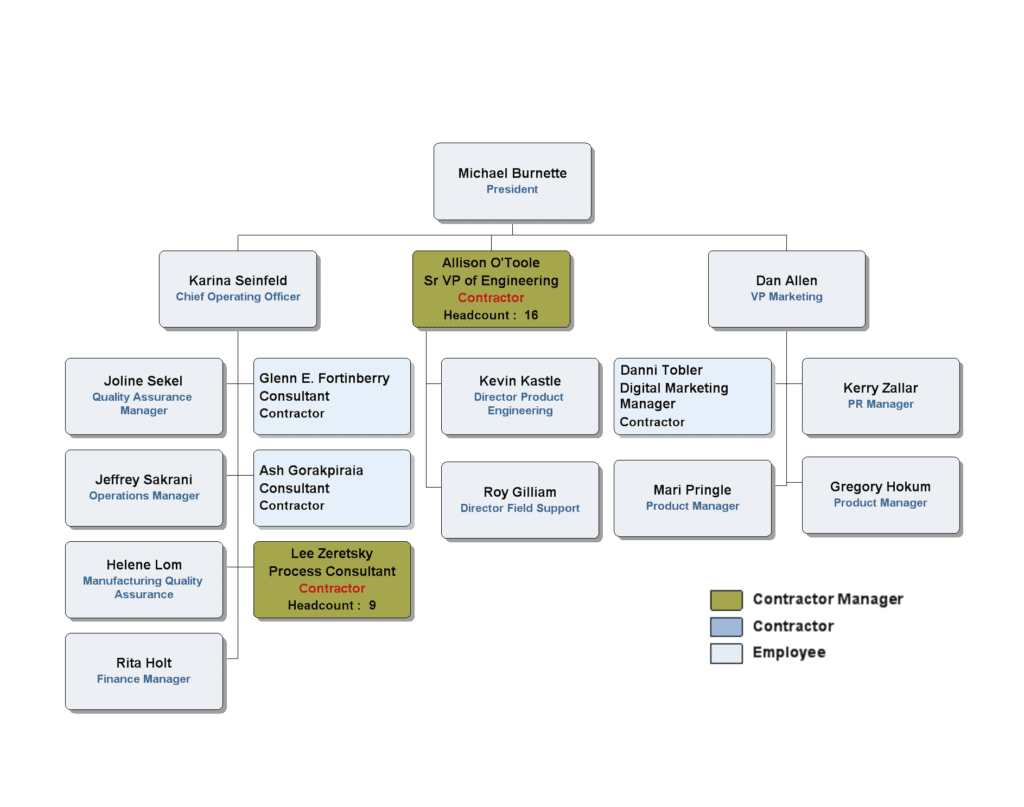
Visualising the Impact of Contractors
Many organisations have contractors working at a variety of levesls. OrgChart lets you highlight contractors and the positions they hold, from key managers to individual contributors, allowing you to see their impact across your organisation.
3/12
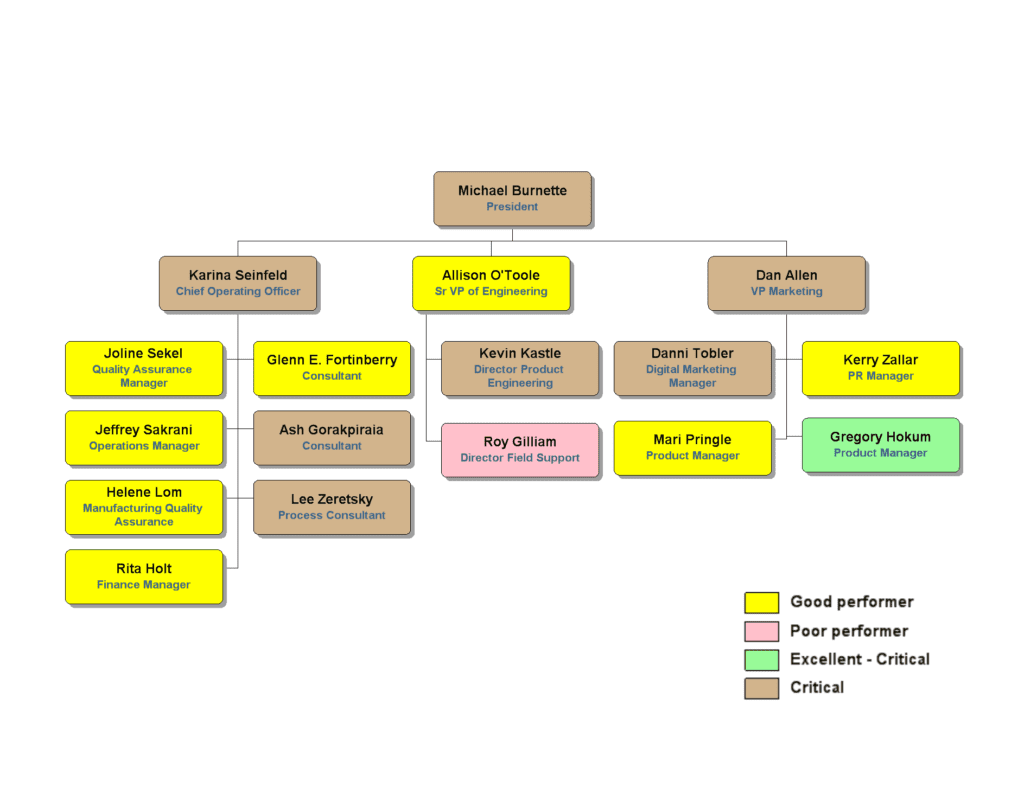
Identifying Critical Staff Performance
This organistional chart identifies critical, key and performance of individuals in the company. OrgChart allows you to set criteria based upon key metrics that your HR department uses then apply formatting to those metrics to visualise those metrics across a group or the entire organisation.
4/12
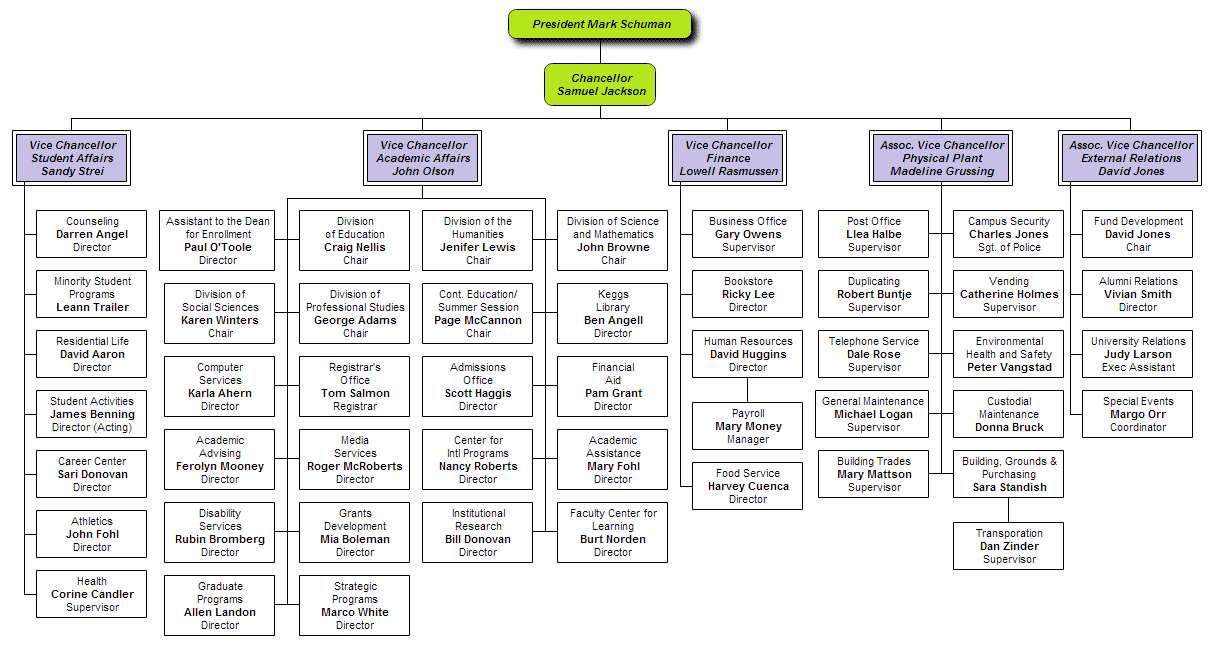
University
This org chart is produced by the IT department. It was published on the university web site and also included in the alumni newsletter. This is an example how OrgChart can handle a high span of control (a manager with a large number of direct reports).
5/12
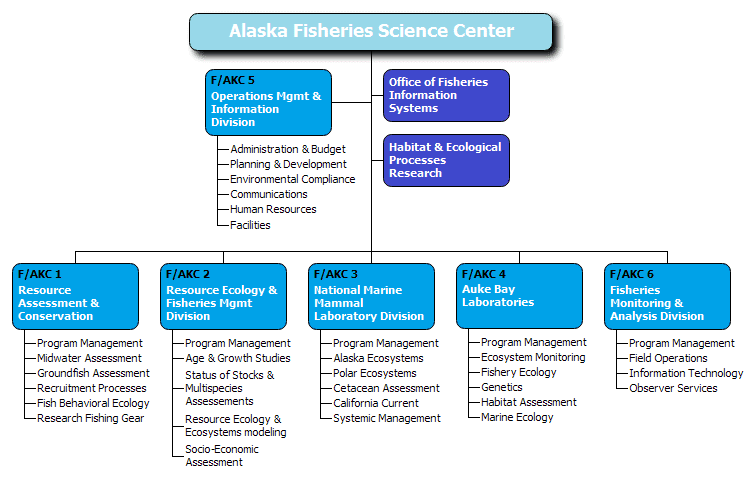
Science Center
This org chart was included in the annual report to the board of directors and is also used to on-board new employees. An EPS version (Encapsulated PostScript) is exported for PowerPoint presentations and an SVG version (Scalable Vector Graphics) is published for posting on the web.
6/12
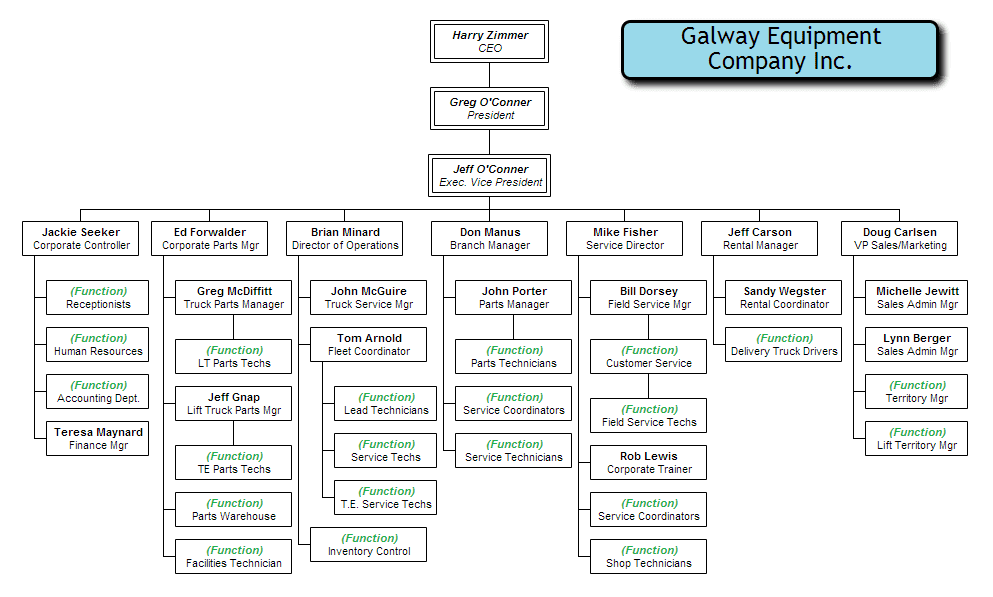
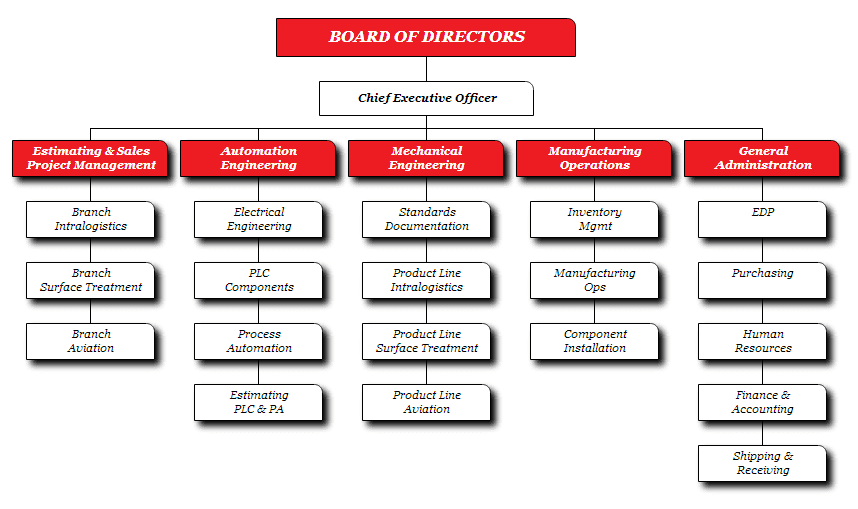
Equipment Company
This org chart is produced weekly by HR for the executive team. Using OrgChart instead of Visio saves HR thirty minutes every week.
7/12
Disaster Recovery Team
This org chart is included in the Disaster Recovery Plan at a major center.
8/12
Organisational Design
This org chart was produced by an organisational change consultant as part of a restructuring exercise. The CEO was so impressed he put a framed a copy on the wall of his office.
9/12
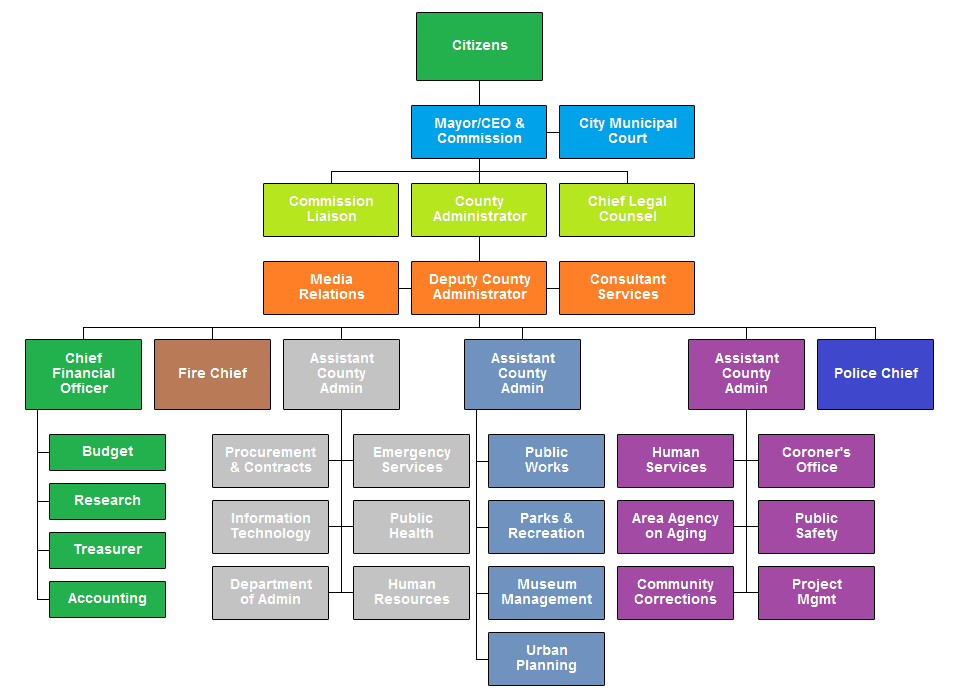
City Government
This org chart was posted on a city’s website to help the community understand how their city government is structured. Using OrgChart® instead of PowerPoint not only produces better results but also makes updating the chart effortless.
10/12
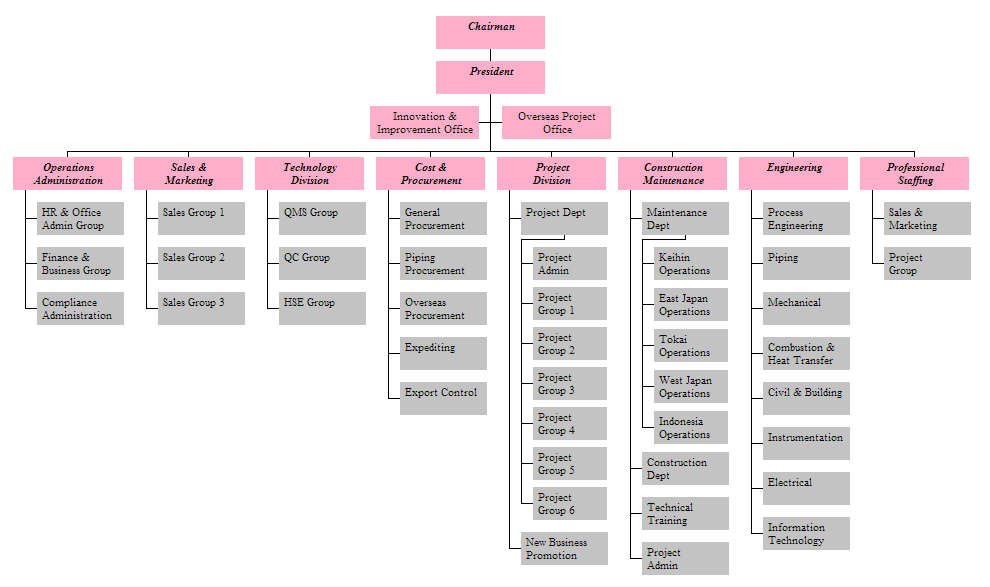
Power Company
This organisation chart is produced by the regulatory & compliance function within a public utility. Before they started using OrgChart®, the single page version was unreadable.
11/12
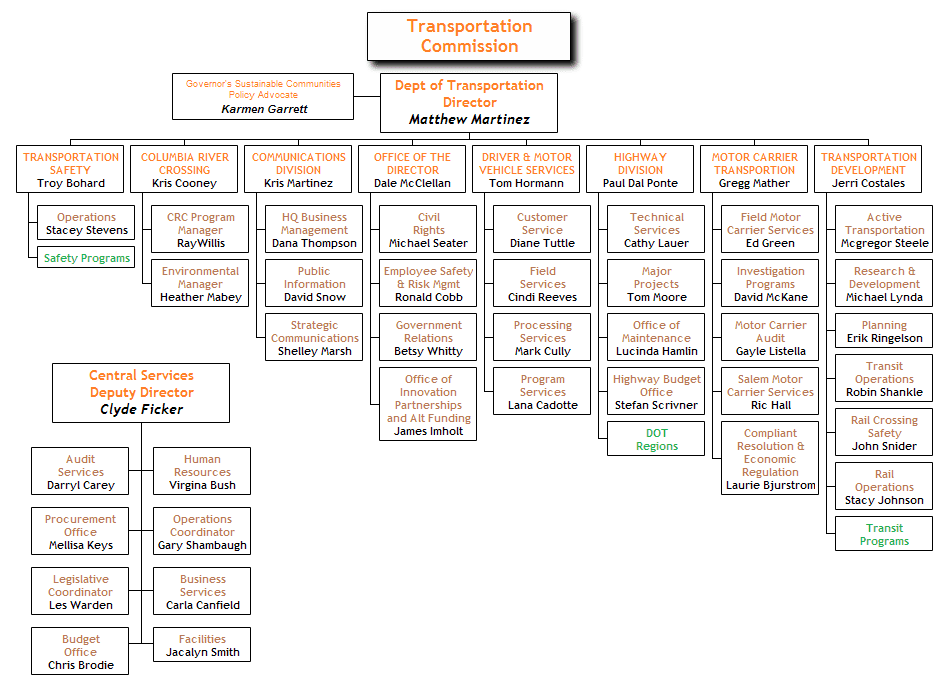
Department of Transportation
This DOT (Department of Transportation) org chart is an example of how most standard charts look. Click on the image to see a second version highlighting how OrgChart Now allows you to place multiple charts on a single page.
12/12
var swiper = new Swiper(".swiper-chart-examples", {
spaceBetween: 30,
speed: 500,
pagination: {
el: ".swiper-pagination",
clickable: true,
},
breakpoints: {
320: {
autoHeight: true,
freeMode: false,
slidesPerView: 1.2,
},
800: {
autoHeight: false,
freeMode: true,
slidesPerView: 1.2,
},
}
});